Probability Distribution
Understanding Probability Distribution
Probability distribution might sound like a fancy term you’d hear at a cocktail party where everyone’s wearing glasses and discussing the stock market. But fear not! It’s really just a way to understand how likely different outcomes are in any given situation. Think of it as the universe’s way of keeping things interesting—like flipping a coin and hoping it lands on heads, but with a bit more math involved.
What is a Probability Distribution?
At its core, a probability distribution is a mathematical function that describes the likelihood of different outcomes for a random variable. In simpler terms, it tells you how likely you are to get certain results when you’re dealing with randomness. For instance, if you’re tossing a fair coin, there’s a 50% chance it’ll land on heads and a 50% chance it’ll land on tails. Simple, right? Now, let’s spice things up a bit.
Types of Probability Distributions
Probability distributions can be classified into two main categories: discrete and continuous. Let’s break them down:
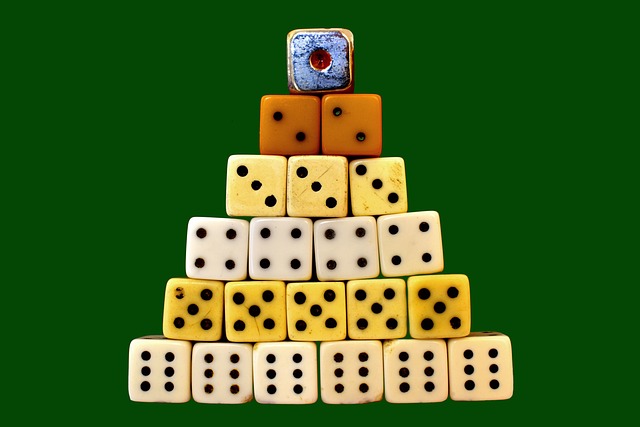
- Discrete Probability Distributions: These deal with outcomes that can be counted. Think of rolling a die. You can get a 1, 2, 3, 4, 5, or 6. Each outcome has a specific probability (1/6 for each, if you’re wondering).
- Continuous Probability Distributions: These involve outcomes that can take on any value within a range. Imagine measuring the height of everyone in a room. You could get 5.5 feet, 5.6 feet, or even 5.55555 feet. The possibilities are endless!
Common Probability Distributions
Now that you know the basics, let’s look at a few common types of probability distributions that you might encounter:
- Binomial Distribution: This is used when there are two possible outcomes—like success or failure. Think of it as your chances of scoring a date after swiping right on a dating app. Spoiler alert: it’s not always a success.
- Normal Distribution: Also known as the bell curve, this distribution is everywhere! It’s like that one friend who shows up to every party uninvited. Most values cluster around the mean, and the further you get from it, the less likely you are to see those values. This is why most people are average—because who wants to be above average, right?
- Poisson Distribution: This one’s for counting occurrences over a fixed interval. If you’re wondering how many times your cat knocks over your favorite mug in a week, this is your go-to distribution.
Visualizing Probability Distributions
Graphs and tables are your best friends when it comes to probability distributions. They help you visualize the likelihood of different outcomes. A graph can show you how likely you are to roll a certain number on a die, while a table can summarize probabilities in a neat little package. It’s like having a cheat sheet for life’s uncertainties—minus the guilt!
Why Should You Care?
Understanding probability distributions can help you make better decisions in life. Whether you’re betting on the outcome of a game, investing in stocks, or simply trying to predict how long your friend will take to get ready, knowing the odds can be a game changer. So, next time you’re faced with uncertainty, remember: there’s a distribution for that!
In conclusion, probability distributions are not just for math nerds in classrooms. They’re all around us, helping us make sense of the chaos that is life. So embrace the randomness, and remember: whether it’s heads or tails, the universe has a plan!


 The Unique Experience of Cruising on Land
 Health
  Fitness
  Lifestyle
  Tech
Tech  Travel
  Food
Food  Education
  Parenting
  Career & Work
  Hobbies
  Wellness
  Beauty
  Cars
Cars  Art
Art  Science
  Culture
  Books
Books  Music
Music  Movies
  Gaming
  Sports
  Nature
  Home & Garden
  Business & Finance
  Relationships
  Pets
Pets  Shopping
  Mindset & Inspiration
  Environment
  Gadgets
  Politics